
Evals shape agent behavior
We’ve been curating evaluations to measure and improve Deep Agents. Deep Agents is an open source, model agnostic agent harness that powers products like Fleet and Open SWE. Evals define and shape agent behavior, which is why it’s so important to design them thoughtfully.
Every eval is a vector that shifts the behavior of your agentic system. For example, if an eval for efficient file reading fails, you’ll likely tweak the system prompt or the read_file tool description to nudge behavior until it passes. Every eval you keep applies pressure on the overall system over time.
It is crucial to be thoughtful when adding evals. It can be tempting to blindly add hundreds (or thousands) of tests. This leads to an illusion of “improving your agent” by scoring well on an eval suite that may not accurately reflect behaviors you care about in production.
More evals ≠ better agents. Instead, build targeted evals that reflect desired behaviors in production.
When building Deep Agents, we catalog the behaviors that matter in production, such as retrieving content across multiple files in the filesystem or accurately composing 5+ tool calls in sequence. Rather than using benchmark tasks in aggregate, we take the following approach to eval curation:
- Decide which behaviors we want our agent to follow. Then research and curate targeted evals that measure those behaviors in a verifiable way.
- For each eval, add a docstring that explains how it measures an agent capability. This ensures each eval is self-documenting. We also tag each eval with categories like
tool_useto enable grouped runs. - Review output traces to understand failure modes and update eval coverage.
Because we trace every eval run to a shared LangSmith project, anyone on the team can jump in to analyze issues, make fixes, and reassess the value of a given eval. This creates shared responsibility for adding and maintaining good evals. Running many models across many evals can also get expensive, so targeted evals save money while improving your agent.
In this blog we cover:
- How we curate data
- How we define metrics
- How we run the evals
How we curate data
There’s a few ways we source evals:
- Using feedback from dogfooding our agents
- Pulling selected evals from external benchmarks (like Terminal Bench 2.0 or BFCL) and often adapting them for a particular agent
- Writing our own (artisanal) evals and unit tests by hand for behaviors we think are important
Dogfooding agents & reading traces are great sources of evals
This makes finding mistakes possible. Traces give us data to understand agent behavior. Because traces are often large, we use a built-in agent like Polly or Insights to analyze them at scale. You can do the same with other agents (like Claude Code or the Deep Agents CLI) plus a way to pull down traces, like the LangSmith CLI. Our goal is to understand each failure mode, propose a fix, rerun the agent, and track progress and regressions over time.
For example, a large fraction of bug-fix PRs are now driven through Open SWE, our open source background coding agent. Teams using it touch many different codebases with different context, conventions, and goals. This naturally leads to mistakes. Every interaction of Open SWE is traced, so those can easily become evals to make sure the mistake doesn’t happen again.
Other evals are pulled and adjusted from existing benchmarks like BFCL for function calling. For coding tasks, we integrate with Harbor to run selected tasks from datasets like Terminal Bench 2.0 tasks in sandboxed environments. Many evals are written from scratch and act as focused tests to observe isolated behavior, like testing a read_file tool.
We group evals by what they test
It’s helpful to have a taxonomy of evals to get a middle view of how agents perform (not a single number, not individual runs).
Here are some categories we define and what they test:
| Category | What It Tests |
|---|---|
file_operations |
File tools (read, write, edit, ls, grep, glob), parallel invocation, pagination |
retrieval |
Finding information across files, search strategies, multi-hop document synthesis |
tool_use |
Selecting the right tool, chaining multi-step calls, tracking state across turns |
memory |
Recalling seeded context, extracting implicit preferences, persisting durable info |
conversation |
Asking clarifying questions for vague requests, sustaining multi-turn dialogue with correct actions |
summarization |
Handling context overflow, triggering summarization, recovering info after compaction |
unit_tests |
SDK plumbing - do our system prompt passthrough, interrupt config, subagent routing, skill path resolution, etc. all work? |
Today, all evals are end-to-end runs of an agent on a task. We intentionally encourage diversity in eval structure. Some tasks finish in a single step from an input prompt, while others take 10+ turns with another model simulating a user.
How we define metrics
When choosing a model for our agent, we start with correctness. If a model can’t reliably complete the tasks we care about, nothing else matters. We run multiple models on our evals and refine the harness over time to address the issues we uncover.
Measuring correctness depends on what's being tested. Most internal evals use custom assertions such as “did the agent parallelize tool calls?”. External benchmarks like BFCL use exact matching against ground truth answers from the dataset. For evals where correctness is semantic like whether the agent persisted the correct thing in memory, we use LLM-as-a-judge.
Once several models clear that bar, we move to efficiency. Two models that solve the same task can behave very differently as in practice. One might take extra turns, make unnecessary tool calls, or move through the task more slowly because of model size. In production, those differences show up as higher latency, higher cost, and a worse overall user experience.
All together, the metrics we measure for each evaluator run are:
| Metric | Definition |
|---|---|
| Correctness | Whether the model completed the task correctly |
| Step ratio | Observed agent steps / ideal agent steps |
| Tool call ratio | Observed tool calls / ideal tool calls |
| Latency ratio | Observed latency / ideal latency |
| Solve rate | Number of expected steps / observed latency, with a score of 0 if the task was not solved correctly |
Solve rate measures how quickly an agent solves a task, normalized by the expected number of steps. Like latency ratio, it captures end-to-end time to solve the task, including model round trips, provider latency, wrong turns, and tool execution time. For simple tasks where we can define an ideal trajectory, solve rate can be easier to work with than latency ratio because it only requires measuring the given agent's task duration.
This gives us a simple way to choose models with a targeted eval set:
- Check correctness first: which models are accurate enough on the tasks you actually care about?
- Then, compare efficiency: among the models that are good enough, which one gives the best tradeoff between correctness, latency, and cost?
Example of useful metrics around evals
To make model comparisons actionable, we examine how models succeed and fail. That requires a concrete reference point for what “good” execution looks like beyond accuracy. One primitive we use is an ideal trajectory. This is a sequence of steps that produces a correct outcome with no “unnecessary” actions.
For simple, well-scoped tasks, the variables are defined tightly enough that the optimal path is usually obvious. For more open-ended tasks, we approximate a trajectory using the best-performing model we’ve seen so far, then revisit the baseline as models and harnesses improve. In this way, observing agent behavior helps us refine our priors about ideal trajectories.
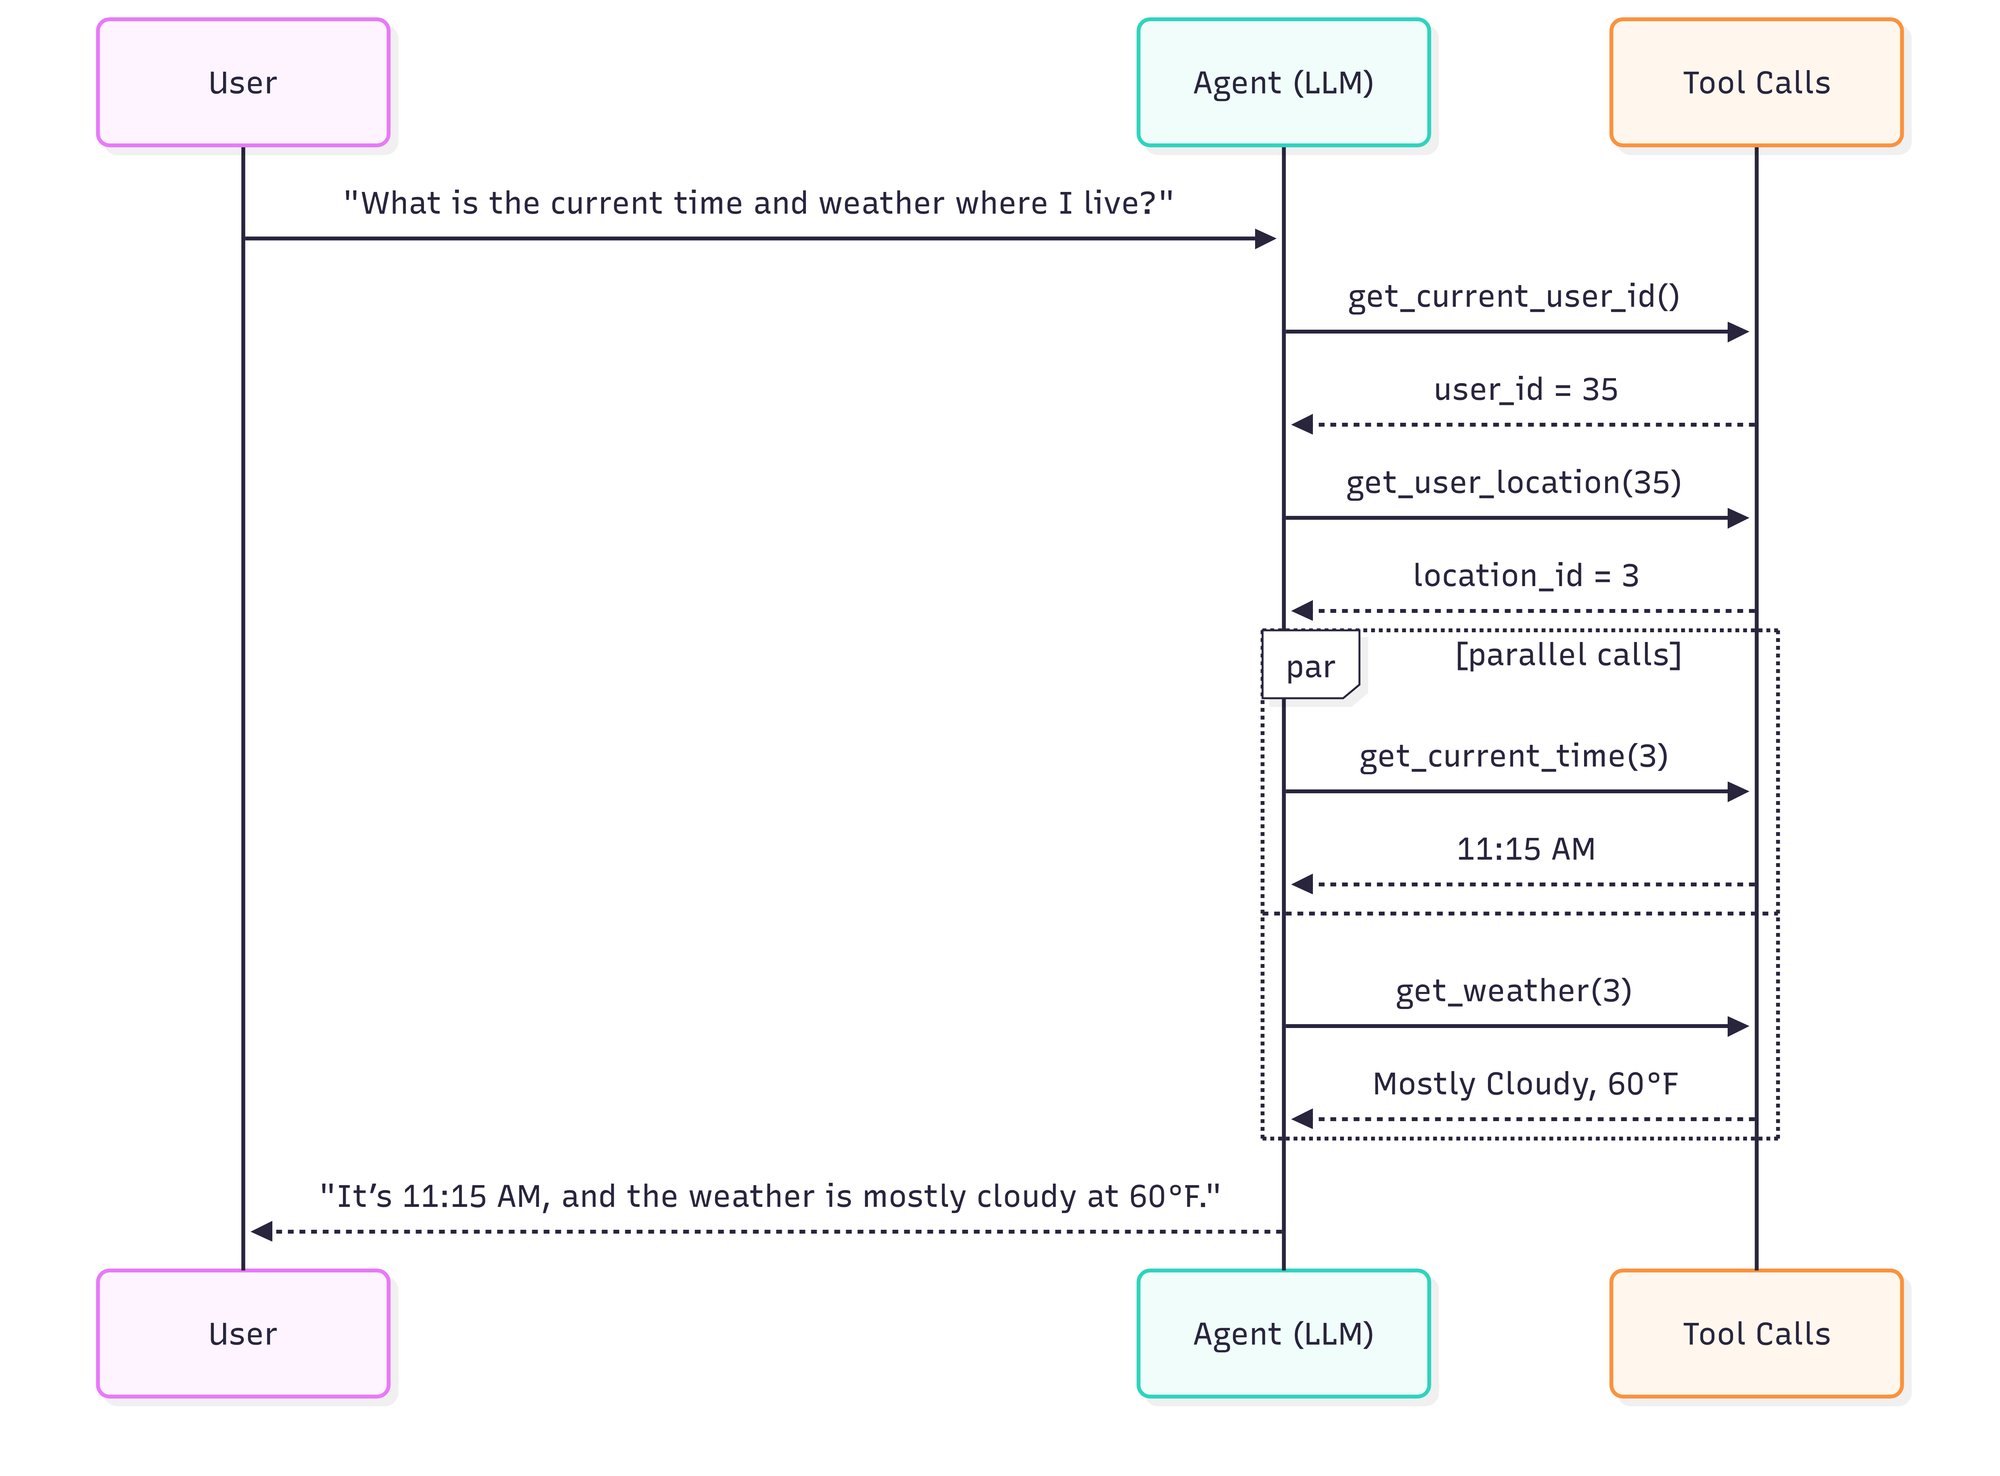
Consider a simple request:
"What is the current time and weather where I live?"
An agent’s ideal trajectory might look like this:
- It makes the fewest necessary tool calls (e.g., resolve user → resolve location → fetch time and weather)
- It parallelizes independent tool calls where possible
- It produces the final answer without unnecessary intermediate turns
Ideal trajectory: 4 steps, 4 tool calls, ~8 seconds
Now compare that with a trajectory that is still technically correct, but less efficient.
Inefficient trajectory: 6 steps, 5 tool calls, ~14 seconds.
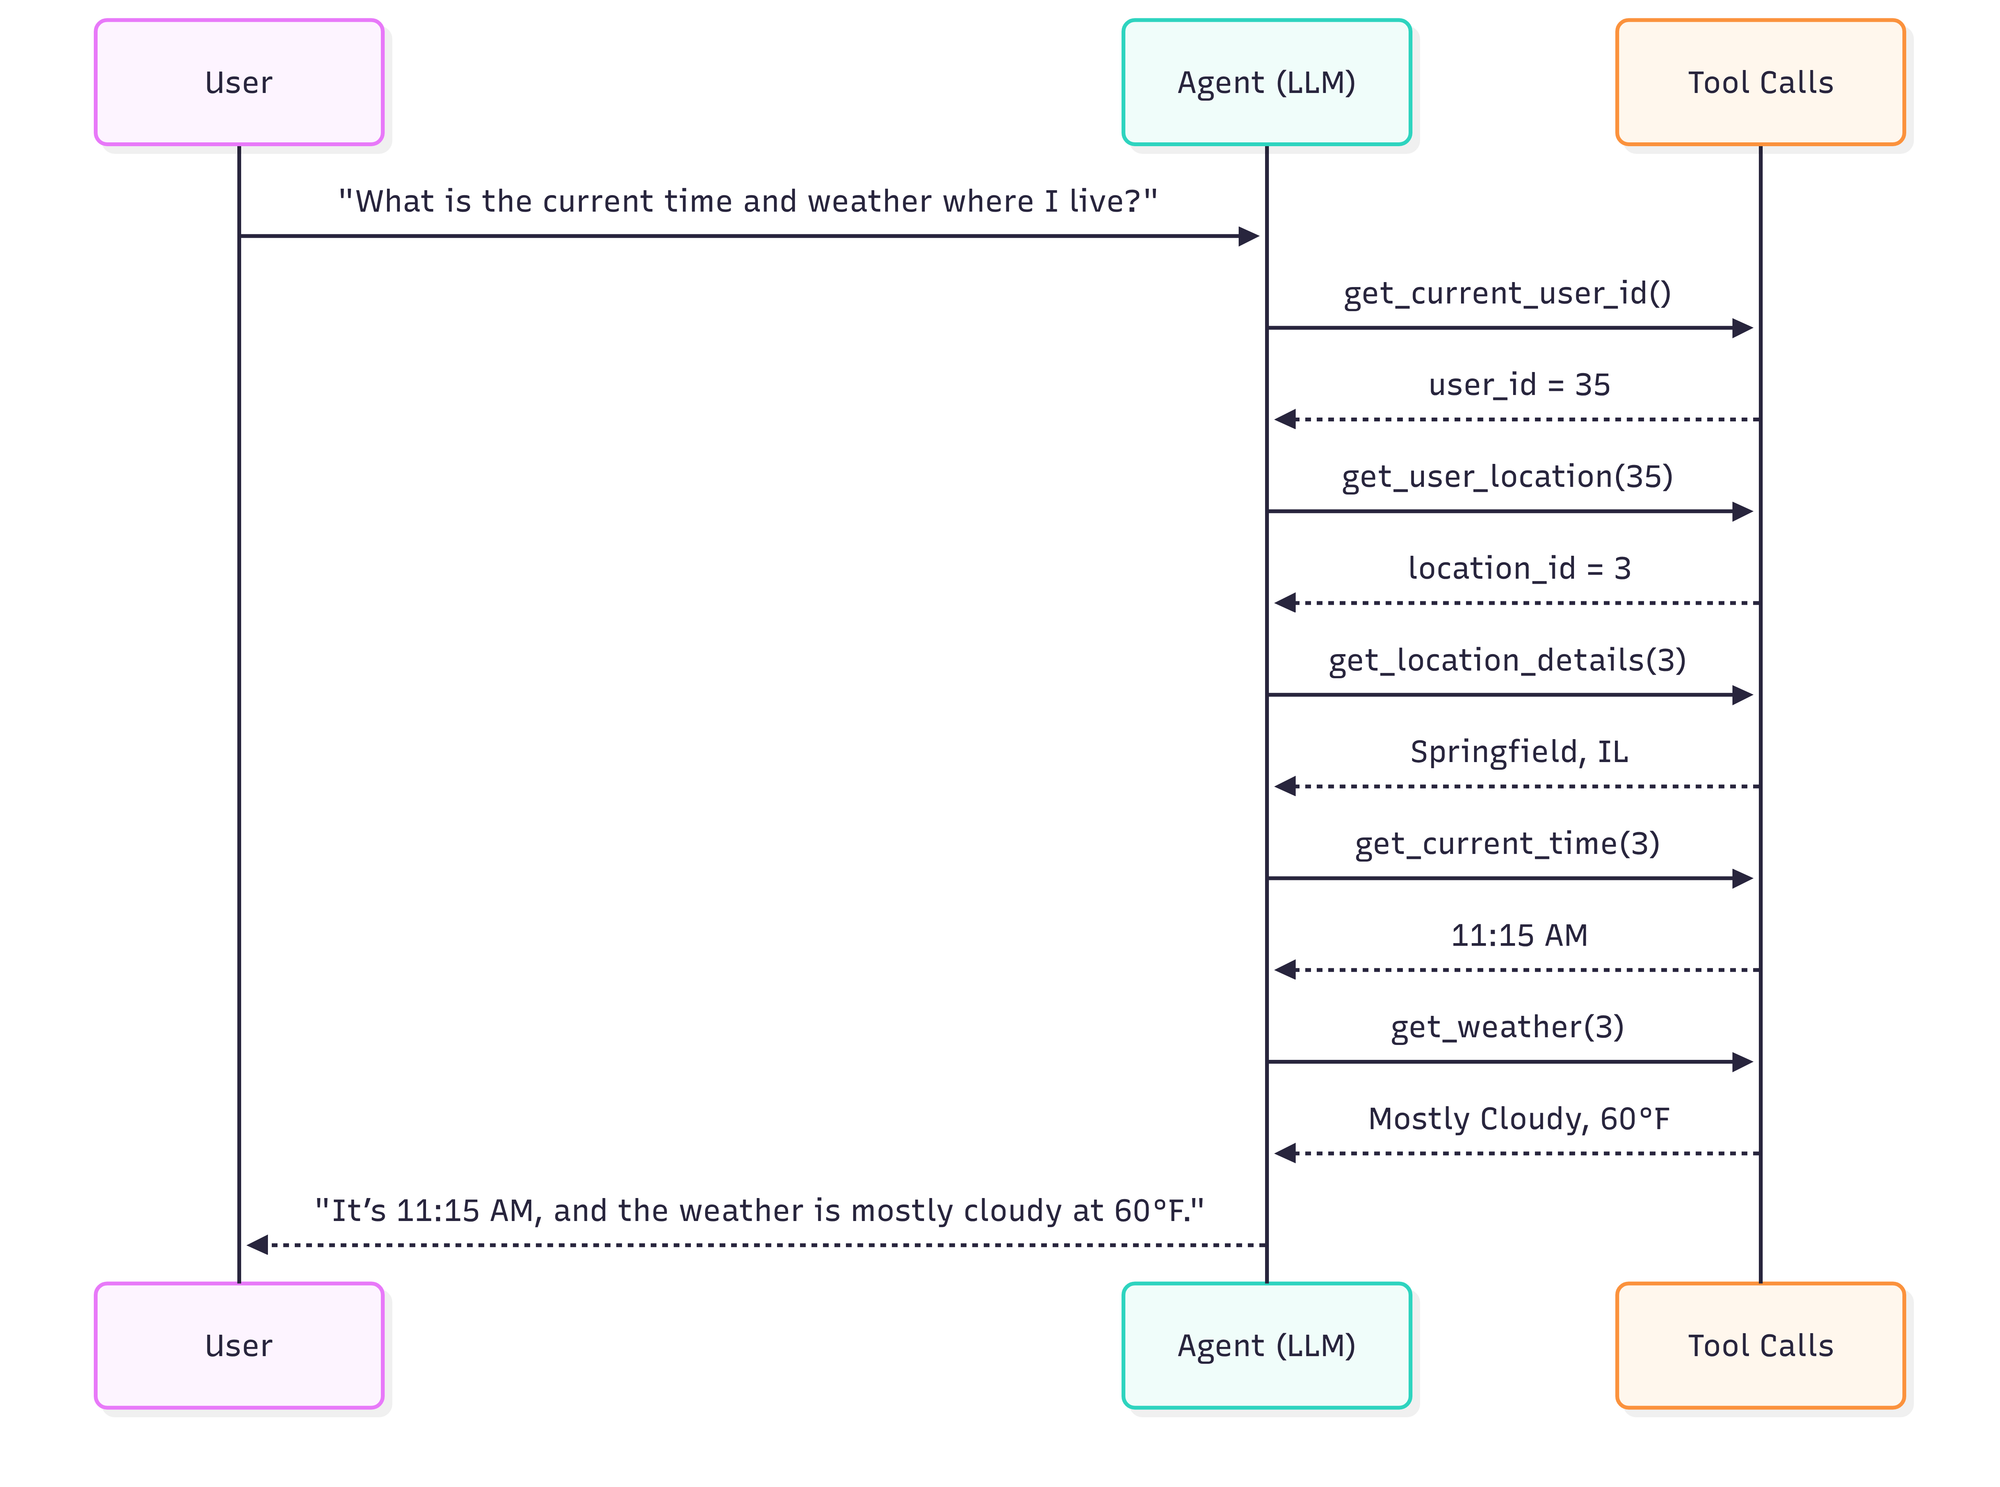
Correct but inefficient trajectory: 6 agent steps, 5 tool calls, includes an unnecessary tool call, and doesn’t parallelize tool calls.
The above examples are illustrative: a REPL could solve this particular task even faster, but the simpler tool-calling version makes the idea easier to explain.
Both runs are correct, but the second run increases latency and cost, and creates more opportunities for failure.
This framing lets us evaluate both correctness and efficiency over evals. We maintain and update metrics to distill the runs into measurable numbers we can use to compare experiments.
From the example above, the inefficient but correct run would score:
| Metric | Definition | Example value | Interpretation |
|---|---|---|---|
| Correctness | Whether the model completed the task correctly | 1 | The run succeeded |
| Step ratio | Observed agent steps / ideal agent steps | 6 / 4 = 1.5 | 50% more agent steps than ideal; lower is better |
| Tool call ratio | Observed tool calls / ideal tool calls | 5 / 4 = 1.25 | 25% more tool calls than ideal; lower is better |
| Latency ratio | Observed latency / ideal latency | 14 / 8 = 1.75 | 75% slower than ideal; lower is better |
| Solve rate | Number of expected steps / observed latency, with a score of 0 if the task was not solved correctly | 4 / 14 = 0.29 expected steps per second | Faster progress through the expected trajectory; higher is better |
How we run evals
We use pytest with GitHub Actions to run evals in CI so changes run in a clean, reproducible environment. Each eval creates a Deep Agent instance with a given model, feeds it a task, and computes correctness and efficiency metrics.
We can also run a subset of eval using tags save costs and measure targeted experiments. For example, if building an agent that requires a lot of local file processing and synthesis, we may focus on the file_operations and tool_use tagged subsets.
export LANGSMITH_API_KEY="lsv2_..."

uv run pytest tests/evals --eval-category file_operations --eval-category tool_use --model baseten:nvidia/zai-org/GLM-5
Our eval architecture and implementation is open sourced in the Deep Agents repository.
What’s next
We’re expanding our eval suite and doing more work around open source LLMs! Some things we’re excited to share soon:
- How Open Models measure against closed frontier models across eval categories
- Evals as a mechanism to auto-improve agents for tasks in real time
- Openly share how we maintain, reduce, and expand evals per agent over time
Deep Agents is fully open source. Try it and let us know what you think! We’re excited to help teams build great agents & evals.